Tag: Testing

  • Testing WebMCP with Playwright

    Testing WebMCP with Playwright

    Websites are no longer just visited by people. More and more, AI agents are browsing the web on our behalf, and they are pretty bad at it: they take screenshots, guess which button to click, and hope for the best. WebMCP is a proposed web standard that wants to fix this. Instead of making agents reverse-engineer your UI, your page tells them exactly what it can do by registering tools. Basically like an MCP server, but right in the browser.

    If you have been following this blog, you know I like to experiment with Web AI and bring MCP to WordPress. So naturally I have been playing with WebMCP quite a bit. And one question kept coming up: how do I actually test this stuff?

    That is why I built playwright-webmcp, a set of testing tools for WebMCP tool surfaces. Let me tell you why you might need it.

    A quick WebMCP primer

    With WebMCP, a page exposes tools through document.modelContext. There are two flavors: imperative tools that you register in JavaScript, and declarative tools where you simply add a few attributes to an existing <form>:

    document.modelContext.registerTool({
      name: "search_products",
      description: "Search the catalogue by keyword",
      inputSchema: {
        type: "object",
        properties: { query: { type: "string", description: "Search term" } },
        required: ["query"],
      },
      annotations: { readOnlyHint: true },
      async execute({ query }) {
        return { products: await searchProducts(query) };
      },
    });Code language: JavaScript (javascript)
    <form toolname="subscribe" tooldescription="Subscribe to the newsletter">
      <input type="email" name="email" toolparamdescription="Email address">
    </form>Code language: HTML, XML (xml)

    A (browser) agent can then discover these tools and call them with structured input. No more pixel guessing. For more comprehensive examples, check out the suite of demos created by Chrome Developer Relations.

    Why testing WebMCP is tricky

    Here is the thing: your tool definitions are now an API. But the consumer of that API is a language model, not a developer reading your docs. That brings a whole new set of failure modes:

    1. Bad descriptions
      A vague or missing description means the model simply won’t pick your tool, or picks the wrong one.
    2. Schemas the browser doesn’t like
      For example, Chrome’s Prompt API rejects null anywhere in a schema or a result. Good luck figuring that out from a silent failure.
    3. Page-level problems
      Two tools with nearly identical descriptions, duplicate names across iframes, or a third-party widget registering a tool called searchProducts right next to your search_products.
    4. Security
      Every string you declare, and every string a tool returns, ends up in a model’s context. That makes tool descriptions and results a prime vector for prompt injection.
    5. Agent behavior
      Even if every tool works in isolation, does an agent actually call the right tools in the right order when a user asks it to do something?

    Some of this is already covered, which is great. Chrome reports problems with declarative forms as DevTools issues, like a missing tool name or description. And Lighthouse has audits for form coverage, for the schema validity of declarative tools, and a listing of all registered tools. But imperative tools, page-level problems, actually calling the tools, or noticing when they change are not part of that. I wanted something that covers the whole picture and can fail a pull request on CI, all while integrating into my existing toolset and without costing me any tokens.

    Meet playwright-webmcp

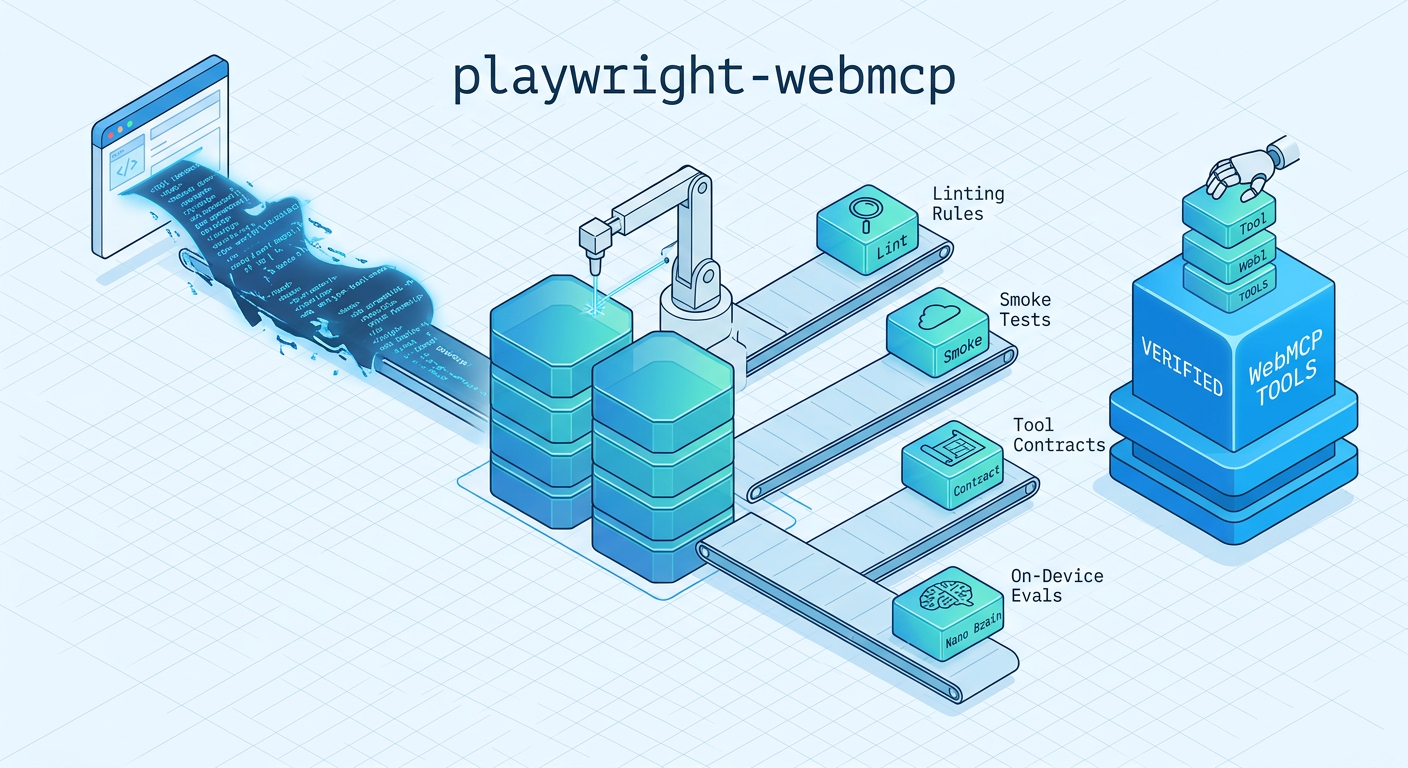
    If you have ever used axe-core for accessibility testing, the architecture will feel familiar. There is one engine that judges tool definitions, and thin adapters around it for wherever those definitions live. The project consists of four packages:

    Some of these lint rules deliberately overlap with what DevTools and Lighthouse report, so that a Playwright test suite can fail a pull request on the same findings. Everything else, from the imperative and page-level rules to smoke runs, tool contracts and on-device evals, hasn’t been covered until now.

    Testing tools with Playwright

    The Playwright package is the heart of it all. It gives you a webmcp fixture that discovers tools in every frame on the page (including cross-origin iframes), lets you call them, and records every call. Here is what a test looks like:

    import { test, expect } from "@swissspidy/playwright-webmcp";
    
    test("shop exposes usable tools", async ({ page, webmcp }) => {
      await page.goto("/");
    
      await expect(webmcp).toHaveTool("search_products", {
        description: /catalogue/,
        inputSchema: { required: ["query"], properties: { query: { type: "string" } } },
      });
    
      await expect(webmcp).toPassLint({ failOn: "warning" });
    
      const { products } = await webmcp.call("search_products", { query: "shirt" });
      await webmcp.call("add_to_cart", { productId: products[0].id, quantity: 2 });
    
      expect(webmcp).toMatchCalls([
        { functionName: "search_products" },
        { functionName: "add_to_cart", arguments: { productId: products[0].id } },
      ]);
    });Code language: JavaScript (javascript)

    Importantly, there is no polyfill. Everything runs against the browser’s own WebMCP implementation, which is currently available in Chromium behind the --enable-features=WebMCP flag. When available, the fixture even hooks into the new WebMCP Chrome DevTools Protocol domain. That way you can observe calls made by Chrome’s built-in agent, which page scripts can’t see. You can of course configure a polyfill inside your app if you’d like.

    Some other things I find really useful:

    • Smoke tests: toPassSmoke() generates inputs from each tool’s schema (valid ones, boundary values, and invalid ones) and checks the results. Is the result too large? Does it contain null? Does a supposedly read-only tool navigate away?
    • Tool contracts: toMatchToolContract() snapshots all your tools and fails with a readable diff when a description or schema changes. A nice agent-facing changelog during code review!
    • Mocks and replay: swap out a tool implementation from your test, so you can test add_to_cart without actually adding things to a cart.
    • A reporter that writes tools.json, coverage.json, and a Markdown TOOLS.md reference across your whole test suite.

    Testing what agents actually do

    Testing tools directly is one thing. But the real question is whether an agent can make sense of them. There is already webmcp-evals, a CLI to run evaluations against WebMCP tools. playwright-webmcp can run the very same eval cases with the exact same matching semantics, so one evals.json file serves both:

    [
      {
        "name": "add two shirts",
        "messages": [{ "role": "user", "type": "message", "content": "Add two red shirts to my cart" }],
        "expectedCall": [
          { "functionName": "search_products", "arguments": { "query": { "$contains": "shirt" } } },
          { "functionName": "add_to_cart", "arguments": { "quantity": 2 } }
        ]
      }
    ]Code language: JavaScript (javascript)

    Who is the agent? You choose! The promptApi fixture drives Chrome’s built-in Prompt API with Gemini Nano right inside the page, just like an in-page agent would. That is the cheapest way to run evals locally, as it doesn’t require any API keys or incur costs. Gemini Nano isn’t the strongest model though, so treat it more as a smoke test for your descriptions.

    For more meaningful results, you can bring your own agent. The toolsForAgent() helper hands the page’s tools to any model or framework running in Node. For example, a ToolLoopAgent from the Vercel AI SDK can be passed straight to toPassEval():

    await expect(webmcp).toPassEval(evalCase, { agent });Code language: JavaScript (javascript)

    Note: I’m not super happy with that API yet, so might have to do some tweaks there. Feedback welcome!

    Catching problems before they ship

    The linter currently comes with 30+ rules: some are in the engine itself, others only exist in the ESLint plugin because they need to read your source code. Some of them are about quality, like missing parameter descriptions or schemas that are too deeply nested. Others are about trust and security, which I think is going to become a really important topic for WebMCP:

    • description-injection flags instruction overrides, role markers, and hidden zero-width characters in any tool text.
    • tool-shadowing catches look-alike tool names registered from different frames or origins. Basically typosquatting for agents.
    • capability-trifecta warns when a tool returns third-party content (think comments or reviews) on a page that also has tools acting on the user’s behalf. Text inside those comments could ask the agent to call them!
    • declarative-autosubmit-sensitive prevents toolautosubmit on forms with password or credit card fields.

    The tool-scoped rules are also available in the ESLint plugin, so you see problems right in your editor:

    // eslint.config.js
    import webmcp from "@swissspidy/eslint-plugin-webmcp";
    
    export default [webmcp.configs.recommended];Code language: JavaScript (javascript)

    And if you just want to check any existing site, without access to its source or tests, simply point the audit CLI at it:

    npx @swissspidy/webmcp-audit https://shop.example --max-pages 20 --smokeCode language: Bash (bash)

    In my opinion, this is a great addition to Lighthouse‘s Agentic Browsing category, which is the right first look at a single page: it lists the registered tools, flags forms without WebMCP annotations, reports the problems Chrome itself raises for declarative tools, and gives the page an agent-readiness score. The audit CLI deliberately leaves scoring to Lighthouse and focuses on what a single-page report can’t do:

    • Calling the tools
      With --smoke, it executes read-only tools with valid, boundary, and invalid inputs derived from their schemas, and judges the results.
    • The whole site
      It crawls same-origin pages and reports tools whose description or schema differ from page to page.
    • Change over time
      With --baseline, an earlier report becomes a contract, so CI can fail when your tool surface changes unexpectedly.
    • Every frame, every rule
      Tools in iframes are audited too, against the full rule set ( including the security rules mentioned above).

    Try it out

    The project is still very early, and so is WebMCP itself. The specification is still changing and Chrome is currently running an origin trial. Expect APIs to move. But that is exactly why now is a good time to get involved and shape things.

    All four packages are available on npm. To get started with the Playwright fixture, install it next to the rule engine:

    npm install --save-dev @swissspidy/playwright-webmcp @swissspidy/webmcp-lint @playwright/testCode language: Bash (bash)

    Check out the GitHub repository for the full documentation, the reference for every lint rule, and a complete example using a React shop. Please give it a try and let me know what you think! Bug reports, feature requests, and pull requests are all very welcome.

  • Getting started with end‑to‑end performance testing in WordPress

    Getting started with end‑to‑end performance testing in WordPress

    Learn how to set up Playwright-based end-to-end performance testing for your own WordPress project.

    Introduction

    End-to-end (E2E) tests are a type of software testing that verifies the behavior of a software application from, well, end to end. They simulate an actual user interacting with the application to verify that it behaves as expected. E2E tests are important because they can help to identify and fix bugs that may not be caught by unit tests or other types of testing. Additionally, they can help to ensure that the application is performing as expected under real-world conditions, with real user flows that are typical for the application. This means starting an actual web server, installing WordPress, and interacting with the website through a browser. For example, the majority of the block editor is covered extensively by end-to-end tests.

    Performance testing

    Browser-based performance testing is a subset of this kind of testing. Such tests measure the speed and reactivity of the website in order to find performance regressions. This includes common metrics such as Web Vitals or page load time, but also dedicated metrics that are more tailored to your project. For instance, Gutenberg tracks things like typing speed and the time it takes to open the block inserter.

    Both WordPress core and Gutenberg use Playwright for end-to-end and performance tests. It supports multiple browsers and operating systems, and provides great developer experience thanks to a resilient API and powerful tooling. If you know Puppeteer, Playwright is a forked and enhanced version of it. The WordPress project is actually still undergoing a migration from Puppeteer to Playwright.

    This article shows how to set up Playwright-based end-to-end tests for your own project, with a focus on performance testing. To familiarize yourself with how Playwright works, explore their Getting Started guide. Would you like to jump straight to the code? Check out this example project on GitHub! It provides a ready-to-use boilerplate for Playwright-based performance tests that you can add to your existing project.

    Using a one-stop solution for performance testing

    Before diving right into the details of writing performance tests and fiddling with reporting, there is also a shortcut to get your feet wet.

    Most of what I cover in this article is also available in a single, ready-to-use GitHub Action. You can easily add it to almost any project with little to no configuration. Here’s an example of the minimum setup needed:

    name: Performance Tests
    on:
      push:
        branches: [ main ]
      pull_request:
        branches: [ main ]
    jobs:
      performance-tests:
        timeout-minutes: 60
        runs-on: ubuntu-latest
    
        steps:
          - name: Checkout
            uses: actions/checkout@v4
    
          - name: Run performance tests
            uses: swissspidy/wp-performance-action@v2
            with:
              plugins: |
                ./path-to-my-awesome-plugin
              urls: |
                /
                /sample-page/Code language: YAML (yaml)

    Using this action will spin up a new WordPress installation, install your desired plugins and themes, run Playwright tests against the provided pages on that site, and print easy to understand results to the workflow summary.

    Performance test results summary on GitHub, showing various collected metrics for a given commit, including things like the number of database queries and total load time.

    This one-stop solution allows you to quickly get started with performance testing in a WordPress context and helps to familiarize yourself with the topic. It might even cover all of your needs already, which would be even better! Another big advantage of such a GitHub Action is that you will automatically benefit from new changes made to it. And If you ever need more, continue reading below to learn how you can do it yourself.

    Update (September 2024): check out my follow-up post about v2 of this GitHub Action using WordPress Playground.

    Setting up Playwright tests for a WordPress plugin/theme

    Reminder: if you want a head start on setting up Playwright tests, check out the example project on GitHub. It provides a ready-to-use boilerplate with everything that’s covered below.

    This article assumes that you are developing WordPress blocks, plugins, themes, or even a whole WordPress site, and are familiar with the common @wordpress/scripts and @wordpress/env toolstack. The env package allows you to quickly spin up a local WordPress site using Docker, whereas the scripts package offers a range of programs to lint, format, build, and test your code. This conveniently includes Playwright tests! In addition to that, the @wordpress/e2e-test-utils-playwright package offers a set of useful helpers for writing Playwright tests for a WordPress project.

    All you need to get started is installing these packages using npm:

    npm install --save-dev @wordpress/scripts @wordpress/env @wordpress/e2e-test-utils-playwrightCode language: Bash (bash)

    To start your server right away, you can run the following command:

    npx --package=@wordpress/env wp-env startCode language: Bash (bash)

    Check out the @wordpress/env documentation on how to further configure or customize your local environment, for example to automatically install and activate your plugin/theme in this new WordPress site.

    Note: if you already have @wordpress/env installed or use another local development environment, skip this step and use your existing setup.

    To run the Playwright tests with @wordpress/scripts, use the command npx wp-scripts test-playwright. If you have a custom Playwright configuration file in your project root directory, it will be automatically picked up. Otherwise, provide the path like so:

    npx wp-scripts test-playwright --config tests/performance/playwright.config.ts

    In a custom config file like this one you can override some of the details from the default configuration provided by @wordpress/scripts. Refer to the documentation for a list of possible options. Most commonly, you would need this to customize the default test timeout, the directory where test artifacts are stored, or how often each test should be repeated.

    Writing your first end-to-end browser test

    The aforementioned utilities package hides most of the complexity of writing end-to-end tests and provides functionality for the most common interactions with WordPress. Your first test could be as simple as this:

    import { test, expect } from '@wordpress/e2e-test-utils-playwright';
    
    test.describe( 'Dashboard', () => {
      test.beforeAll( async ( { requestUtils } ) => {
        await requestUtils.activateTheme( 'twentytwentyone' );
      } );
    
      test( 'Should load properly', async ( { admin, page } ) => {
        await admin.visitAdminPage( '/' );
        await expect(
            page.getByRole('heading', { name: 'Welcome to WordPress', level: 2 })
        ).toBeVisible();
      } );
    } );Code language: JavaScript (javascript)

    When running npx wp-scripts test-playwright, this test visits /wp-admin/ and waits for the “Welcome to WordPress” meta box heading to be visible. And before all tests run (in this case there is only one), it ensures the Twenty-Twenty One theme is activated. That’s it! No need to wait for the page to load or anything, Playwright handles everything for you. And thanks to the locator API, the test is self-explanatory as well.

    Locators are very similar to what’s offered by Testing Library in case you have used that one before. But if you are new to this kind of testing API, it’s worth strolling through the documentation a bit more.
    That said, the easiest way to write a new Playwright test is by recording one using the test generator. That’s right, Playwright comes with the ability to generate tests for you as you perform actions in the browser and will automatically pick the right locators for you. This can be done using a VS Code extension or by simply running npx playwright codegen. Very handy!

    Setting up performance tests

    The jump from a simple end-to-end test to a performance test is not so big. The key difference is performing some additional tasks after visiting a page, further processing the collected metrics, and then repeating all that multiple times to get more accurate results. This is where things get interesting!

    First, you need to determine what you want to measure. When running performance tests with an actual browser, it’s of course interesting to simply measure how fast your pages load. From there you can expand to measuring more client-side metrics such as specific user interactions or Web Vitals like Largest Contentful Paint. But you can also focus more on server-side metrics, such as how long it takes for your plugin to perform a specific task during page load. It all depends on your specific project requirements.

    Writing your first performance test

    Putting all of these pieces together, we can turn a simple end-to-end test into a performance test. Let’s track the time to first byte (TTFB) as a start.

    import { test } from '@wordpress/e2e-test-utils-playwright';
    
    test.describe( 'Front End', () => {
      test.use( {
        storageState: {}, // User will be logged out.
      } );
    
      test.beforeAll( async ( { requestUtils } ) => {
        await requestUtils.activateTheme( 'twentytwentyone' );
      } );
    
      const iterations = 20;
      for ( let i = 1; i <= iterations; i++ ) {
        test( `Measure TTFB (${ i } of ${ iterations })`, async ( {
          page,
          metrics,
        } ) => {
          await page.goto( '/' );
    
          const ttfb = await metrics.getTimeToFirstByte();
    
          console.log( `TTFB: ${ttfb}`);
        } );
      }
    } );Code language: JavaScript (javascript)

    What’s standing out is that Playwright’s storageState is reset for the tests, ensuring that tests are performed as a logged-out user. This is because being logged in could skew results. Of course for some other scenarios this is not necessarily desired. It all depends on what you are testing.

    Second, a for loop around the test() block allows running the test multiple times. It’s worth noting that the loop should be outside the test and not inside. This way, Playwright can ensure proper test isolation, so that a new page is created with every iteration. It will be completely isolated from the other pages, like in incognito mode.

    The metrics object used in the test is a so-called test fixture provided by, you guessed it, the e2e utils package we’ve previously installed. How convenient! From now on, most of the time we will be using this fixture.

    Measuring all the things

    Server-Timing

    The Server-Timing HTTP response header is a way for the server to send information about server-side metrics to the client. This is useful to get answers for things like:

    • Was there a cache hit
    • How long did it take to load translations
    • How long did it take to load X from the database
    • How many database queries were performed
    • How much memory was used

    The last ones are admittedly a bit of a stretch. Server-Timing is meant for duration values, not counts. But it’s the most convenient way to send such metrics because they can be processed in JavaScript even after a page navigation. For Playwright-based performance testing this is perfect.

    In WordPress, the easiest way to add Server-Timing headers is by using the Performance Lab plugin. By default it supports exposing the following metrics:

    • wp-before-template: Time it takes for WordPress to initialize, i.e. from the start of WordPress’s execution until it begins sending the template output to the client.
    • wp-template: Time it takes to compute and render the template, which begins right after the above metric has been measured.
    • wp-total: Time it takes for WordPress to respond entirely, i.e. this is simply the sum of wp-before-template + wp-template.

    Additional metrics can be added via the perflab_server_timing_register_metric() function. For example, this adds the number of database queries to the header:

    add_action(
    	'plugins_loaded',
    	static function() {
    		if ( ! function_exists( 'perflab_server_timing_register_metric' ) ) {
    			return;
    		}
    	
    		perflab_server_timing_register_metric(
    			'db-queries',
    			array(
    				'measure_callback' => static function( Perflab_Server_Timing_Metric $metric ) {
    					add_action(
    						'perflab_server_timing_send_header',
    						static function() use ( $metric ) {
    							global $wpdb;
    							$metric->set_value( $wpdb->num_queries );
    						}
    					);
    				},
    				'access_cap'       => 'exist',
    			)
    		);
    	}
    );Code language: PHP (php)

    Once you have everything set up, WordPress will send an HTTP header like this with every response:

    Server-Timing:
    wp-before-template;dur=110.73, wp-template;dur=143, wp-total;dur=253.73, wp-db-queries;dur=27

    Again, the number of database queries is not a duration, but if it works, it works!

    In Playwright tests, this is how you can retrieve the values:

    test.describe( 'Homepage', () => {
      test( 'Server-Timing', async ( { page, metrics } ) => {
        await page.goto( '/' );
        const serverTiming = await metrics.getServerTiming();
    
        // {
        //   'wp-before-template': 110.73,
        //   'wp-template': 143,
        //   'wp-total': 253.73,
        //   'wp-db-queries': 27,
        // }
      } );
    } );Code language: JavaScript (javascript)

    Load time metrics

    Besides getServerTiming() and getTimeToFirstByte(), the metrics fixture provides a handful of other helpers to measure certain load time metrics to make your life easier:

    • getLargestContentfulPaint: Returns the Largest Contentful Paint (LCP) value using the dedicated API.
    • getCumulativeLayoutShift: Returns the Cumulative Layout Shift (CLS) value using the dedicated API.
    • getLoadingDurations: Returns the loading durations using the Navigation Timing API. All the durations exclude the server response time. The returned object contains serverResponse, firstPaint, domContentLoaded, loaded, firstContentfulPaint, timeSinceResponseEnd.

    Some of these methods are mostly there because it’s trivial to retrieve the metrics, but not all of these might make sense for your use case.

    Tracing

    The metrics fixture provides an easy way to access Chromium’s trace event profiling tool. It allows you to get more insights into what Chrome is doing “under the hood” when interacting with a page. To give you an example of what this means, in Gutenberg this is used to measure things like typing speed.

    // Start tracing.
    await metrics.startTracing();
    
    // Type the testing sequence into the empty paragraph.
    await paragraph.type( 'x'.repeat( iterations ) );
    
    // Stop tracing.
    await metrics.stopTracing();
    
    // Get the durations.
    const [ keyDownEvents, keyPressEvents, keyUpEvents ] =
        metrics.getTypingEventDurations();Code language: JavaScript (javascript)

    In addition to getTypingEventDurations() there are also getSelectionEventDurations(), getClickEventDurations(), and getHoverEventDurations().

    Lighthouse reports

    The @wordpress/e2e-test-utils-playwright package has basic support for running Lighthouse reports for a given page. Support is basic because it only performs a handful of audits and does not yet allow any configuration. Also, due to the way Lighthouse works, it’s much slower than taking similar measurements by hand using simple JavaScript snippets. That’s because it does a lot of things under the hood like applying CPU and network throttling to emulate mobile connection speeds. Still, it can be useful to compare numbers and provide feedback to the folks working on this package to further improve it. A basic example:

    test.describe( 'Homepage', () => {
      test( 'Lighthouse', async ( { page, lighthouse } ) => {
        await page.goto( '/' );
        const report = await lighthouse.getReport();
    
        // {
        //   'LCP': 123,
        //   'TBT': 456,
        //   'TTI': 789,
        //   'CLS': 0.01,
        //   'INP': 321,
        // }
      } );
    } );Code language: JavaScript (javascript)

    This one line is enough to run a Lighthouse report, which involves opening a new isolated browser instance on a dedicated port for running tests in.

    Interactivity metrics

    The metrics fixture already provides ways to get some Web Vitals values such as First Contentful Paint (FCP), Largest Contentful Paint (LCP), and Cumulative Layout Shift (CLS). They cover loading performance and layout stability. Interaction to Next Paint (INP), a pending Core Web Vital metric that will replace First Input Delay (FID) in March 2024, is notably absent from that list. That’s because it’s not so trivial to retrieve, as it requires user interaction.

    INP is a metric that assesses a page’s overall responsiveness to user interactions. It does so by observing the latency of all click, tap, and keyboard interactions that occur throughout the lifespan of a user’s visit to a page. The final INP value is the longest interaction observed, ignoring outliers. So how can you measure that reliably in an automated test? Enter the web-vitals library.

    This library is the easiest way to measure all the Web Vitals metrics in a way that accurately matches how they’re measured by Chrome and reported to tools like PageSpeed Insights.

    As of very recently (i.e. it’s not even released yet!), the metrics fixture has preliminary support for web-vitals.js and allows measuring web vitals using one simple method:

    await page.goto( '/' );
    
    console.log( await metrics.getWebVitals() );Code language: JavaScript (javascript)

    Under the hood, this will refresh the page while simultaneously loading the library and collecting numbers. This will measure CLS, FCP, FID, INP, LCP, and TTFB metrics for the given page and return all the ones that exist.

    Again, metrics like INP require user interaction. To accommodate for that, separate the loading and collection part like so:

    await metrics.initWebVitals( /* reload */ false );
    await page.goto( '/some-other-page/' ); // web-vitals.js will be loaded now.
    // Interact with page here...
    console.log( await metrics.getWebVitals() );Code language: JavaScript (javascript)

    You may find that retrieving web vitals using this single method is easier than calling separate getLargestContentfulPaint() and getCumulativeLayoutShift() methods, though the reported numbers will be identical. In the future these methods may be consolidated into one.

    Making sense of performance metrics

    With the foundation for running performance tests set and all these functions to retrieve various metrics available, the next step is to actually collect all this data in a uniform way. What’s needed is a way to store results and ideally compare them with earlier results. This is so you are actually able to make sense of all these metrics and to identify performance regressions.

    For this purpose, I’ve built a custom test reporter that takes metrics collected in tests and combines them all in one single file. Then, a second command-line script formats the data and optionally does a comparison as well. The reporter and the CLI script are both available on the demo GitHub repository, together with all the other example code from this article. Here’s an example output by this script:

    Note: there is work underway to further refine these scripts and make them easier available through a dedicated npm package. Imagine a single package like @wordpress/performance-tests that provides the whole suite of tools ready to go! This is currently being discussed and I will update this post accordingly when something like this happens.

    In a GitHub Action, you would run this combination of scripts in this order:

    1. Start web server (optional, as Playwright will start it for you otherwise)
    2. Run tests
    3. Optionally run tests for the previous commit or target branch
      1. The raw results are also available as a build artifact and a step output. This way you don’t have to unnecessarily run tests twice but can reuse previous results
    4. Run the CLI script to format results and optionally compare them with the ones from step 3

    Here’s an example of what that could look like.

    Tracking performance metrics over time

    Eventually you will get to a point where you want to see the bigger picture and track your project’s performance over time. For example using a dedicated dashboard such as the one WordPress core currently uses.

    Screenshot of the codevitals.run dashboard for WordPress core, tracking all the different metrics

    When doing so, you will inevitably need to deal with data storage and visualization, and things like variance between individual runs. These are not yet currently solved problems, both for WordPress projects but also in general. In a future blog post I plan to go a bit more in depth on this side of things and show you how to set this up for your project, allowing you to make more sense of performance metrics over time.

    Conclusion

    With the foundation from this blog post you should be able to start writing and running your first performance tests for your WordPress project. However, there is still a lot that can be covered and optimized, as performance testing can be quite a complex matter.

    For now, I do recommend checking out the WordPress performance tests GitHub action as well as the demo repository I set up with the complete testing setup. Oh, and bookmark the Playwright documentation just in case.

    This topic is obviously top of mind for me and also the WordPress core performance team, so expect some more updates in this regard in the future. I do recommend following on X/Twitter and the make/performance blog for updates on all things performance testing.

    And of course please let me know your thoughts in the comments so the team and I can further refine the techniques shared in this post. Thanks for reading!